
Reading the report
This page walks through the HTML report (ui-coverage-report/index.html): what the sidebar, screenshots and tables show, and how to use them to find and close gaps.
Views and coverage
The sidebar lists every view (a page of your app) with its coverage. Dynamic URL segments are grouped automatically (/users/1, /users/2 → /users/:id); Views explains how to name views yourself.
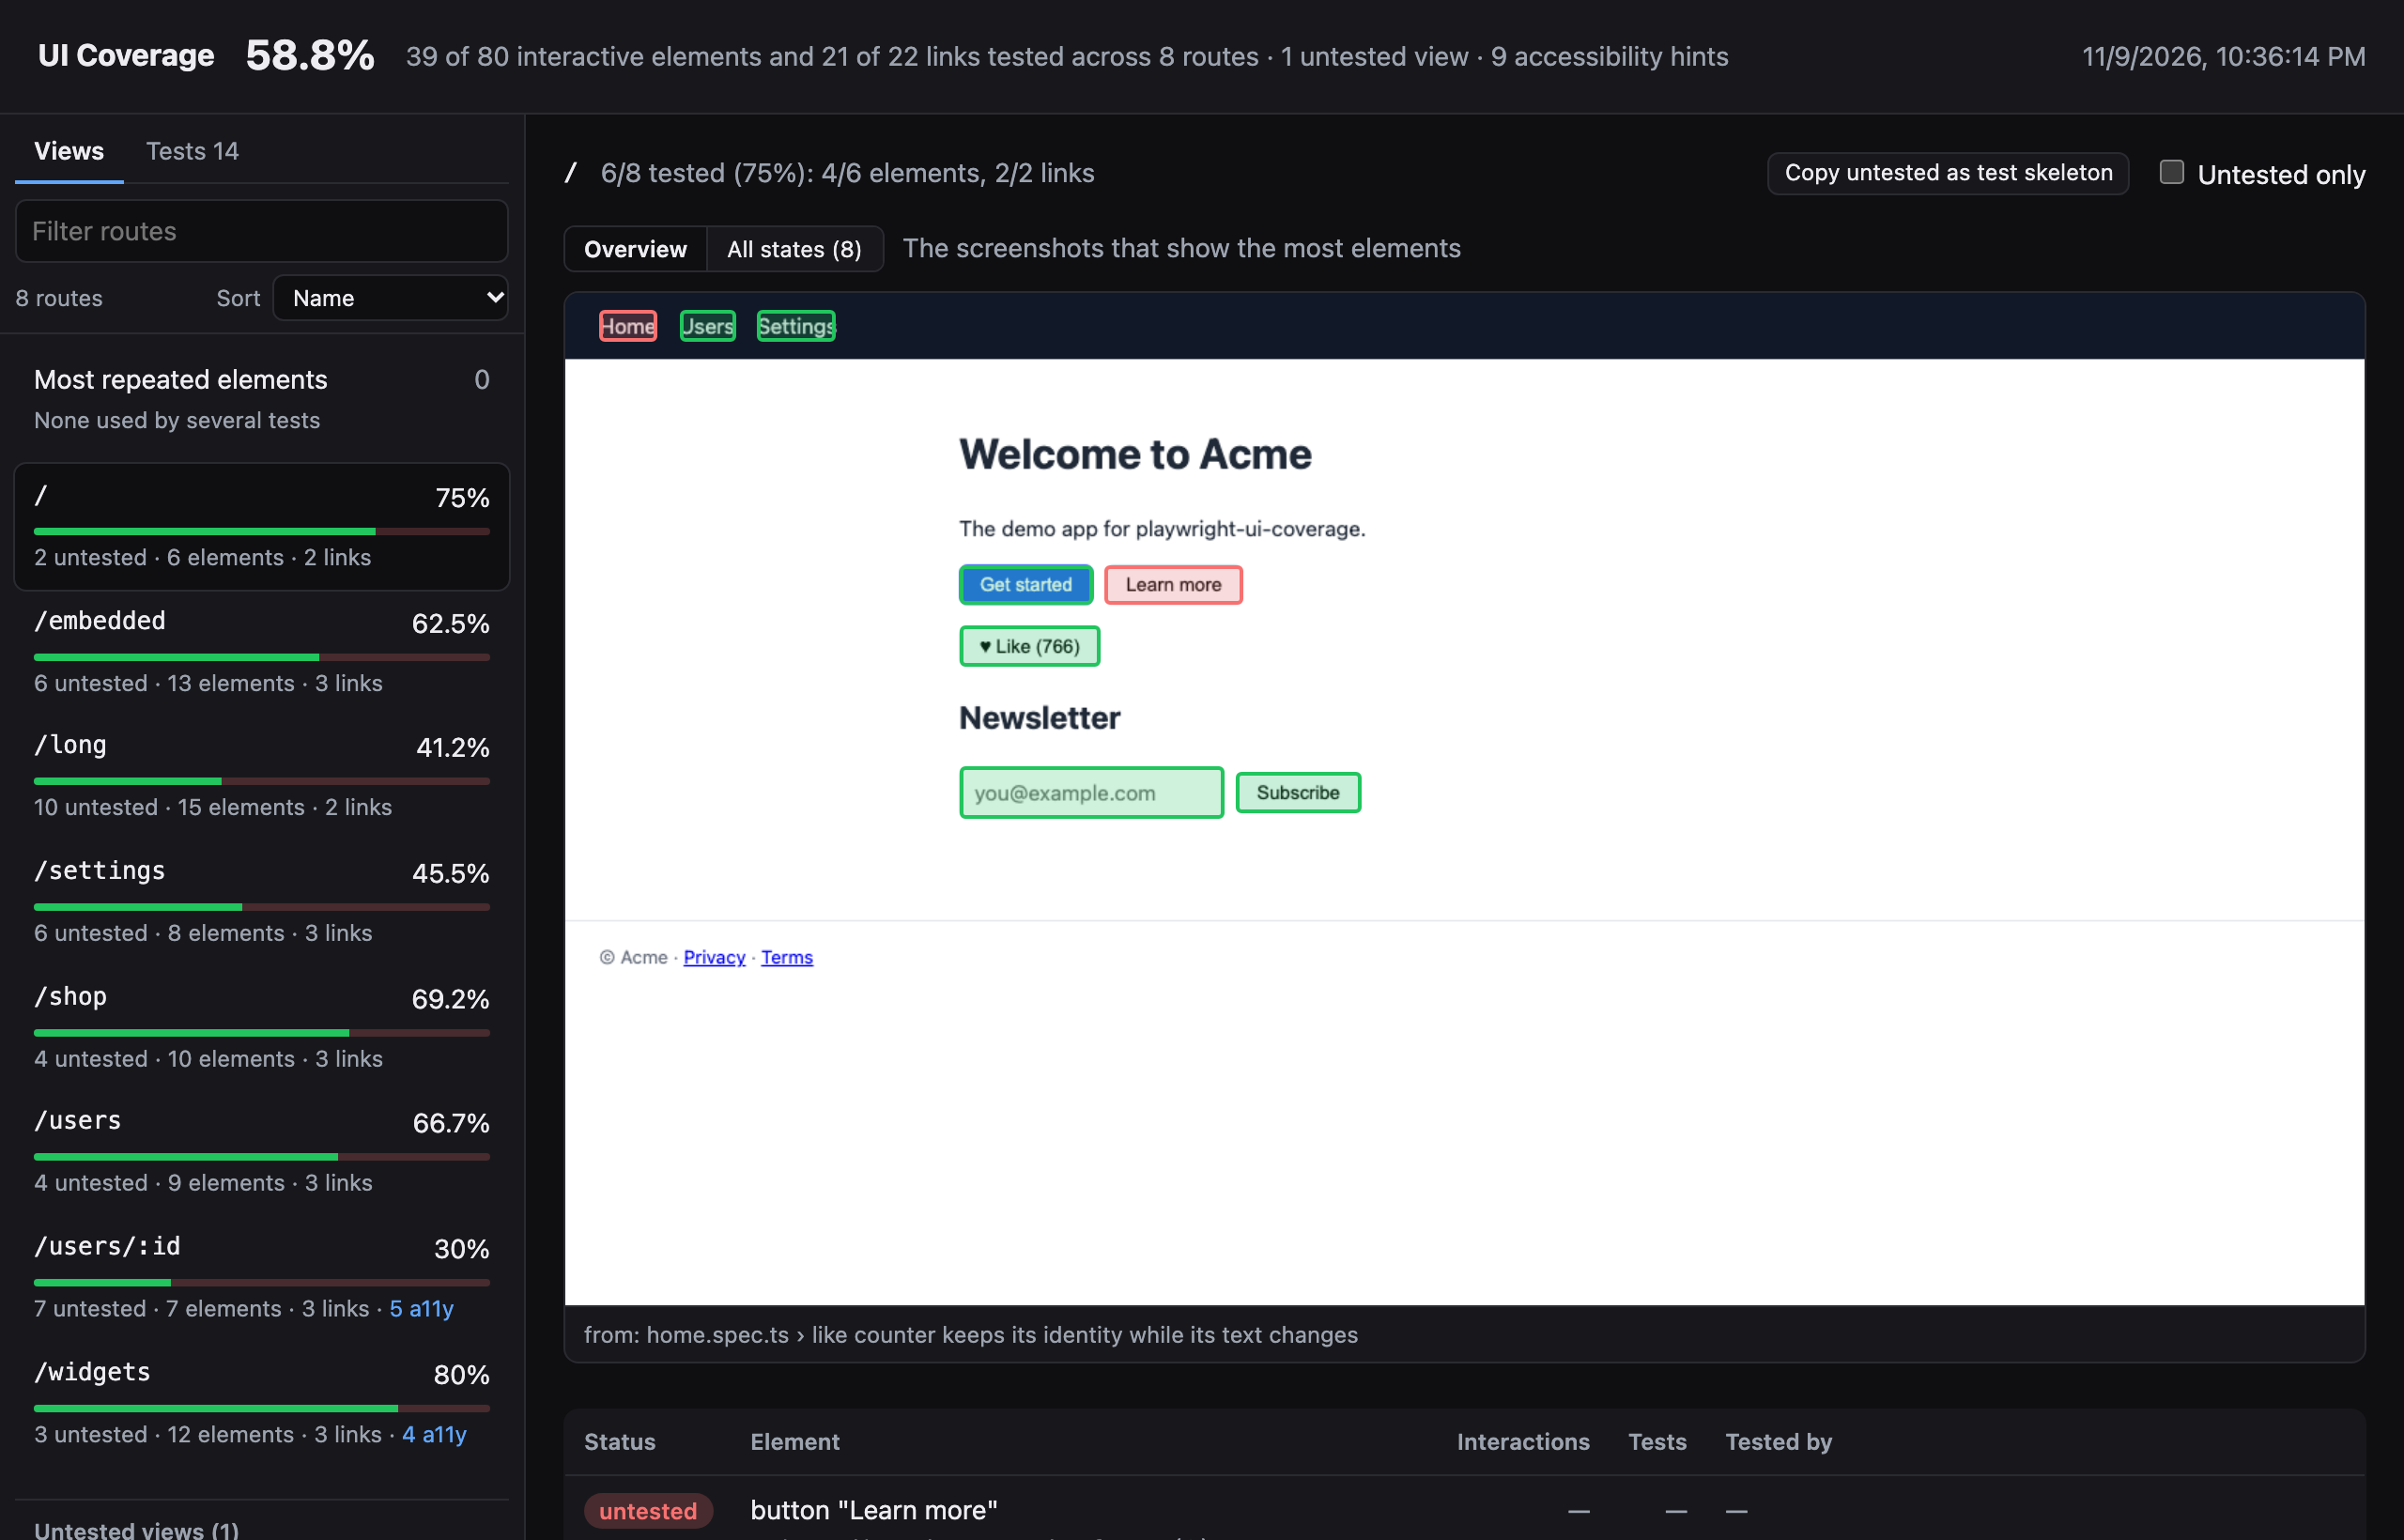
Each view shows up to three screenshots (maxScreenshotsPerRoute), chosen to show the most elements, with every interactive element outlined:
- green: a test interacted with it;
- red: no test did;
- amber (failing tests only): only tests that never passed touched it. It counts as untested, see Retries and failed tests.
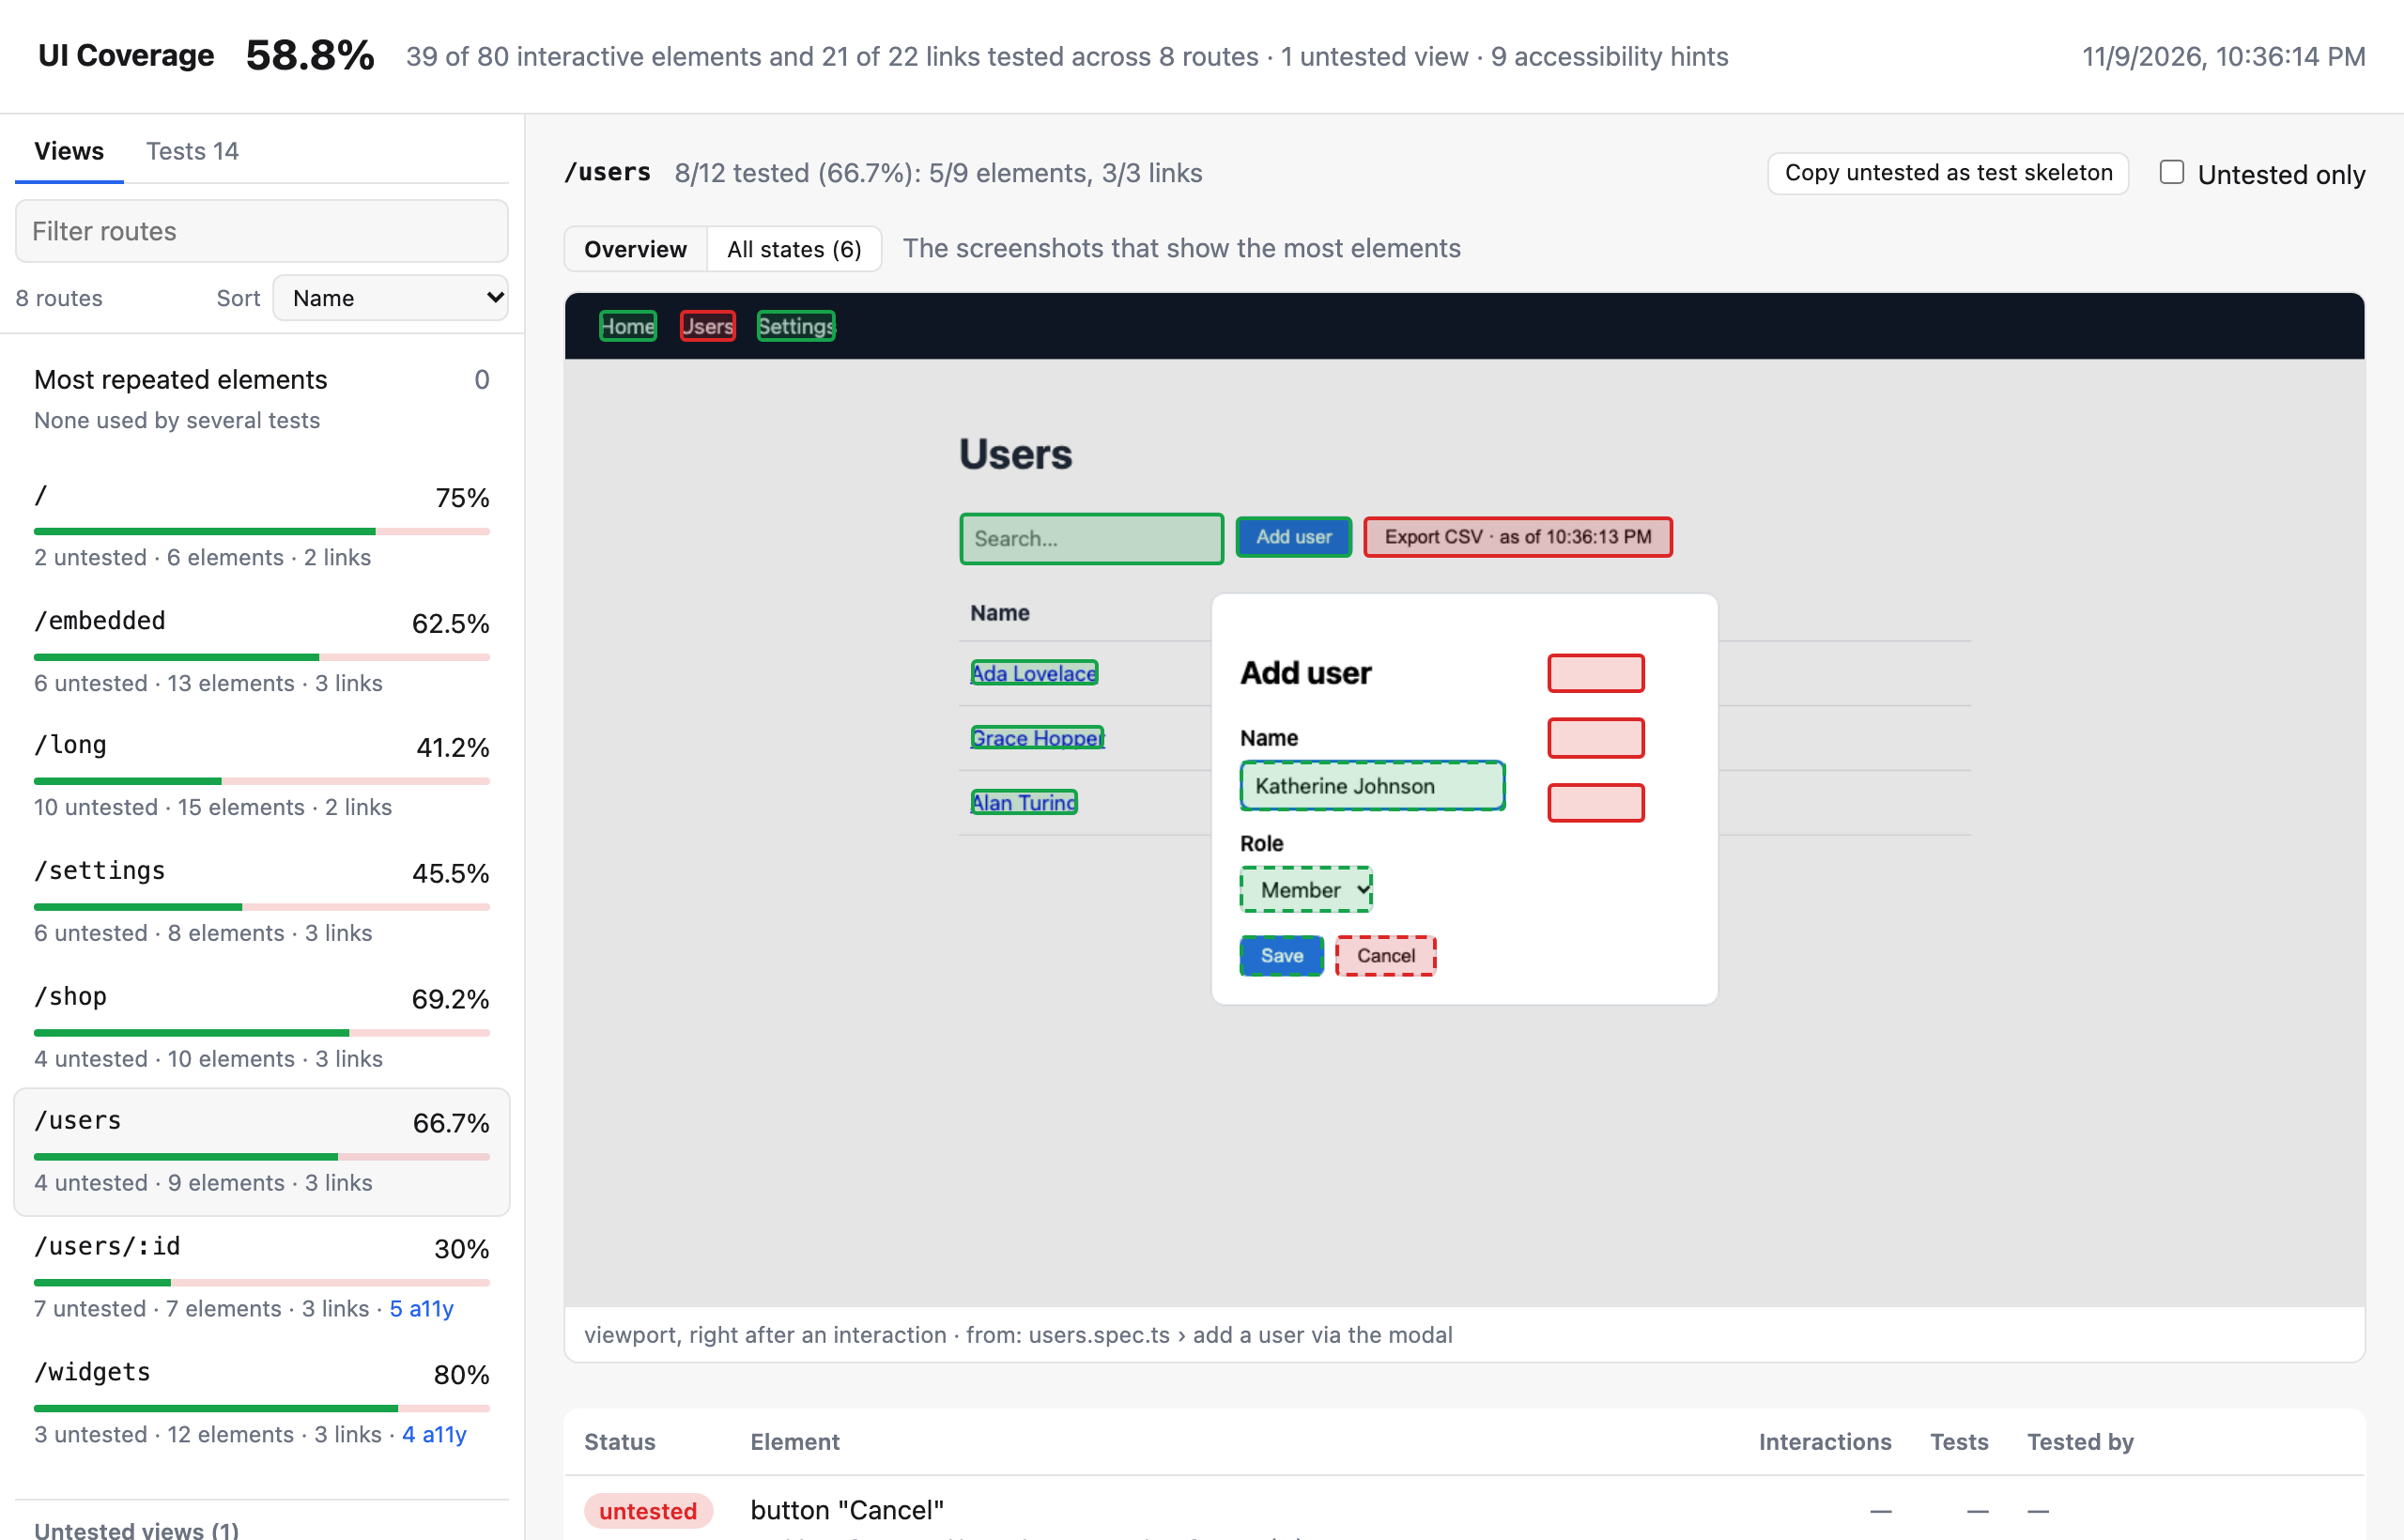
Boxes of position: fixed and sticky elements are drawn dashed, see Screenshots. Screenshots of short-lived states (a modal a test opened and closed quickly) are captioned "viewport, right after an interaction".
Step through every state
The three screenshots are the overview. All states goes through every screenshot taken on the view, from every test, in the order the tests reached them: ◀ State n of N ▶, or the ← and → keys. Each state shows:
- the screenshot with the usual green and red boxes;
- its own coverage: how many of the elements in it are tested;
- Reached by: the tests (and retries) that produced it, each linking to the test and its trace in Playwright's HTML report, as under "Tested by". The same screen reached by several tests is one state.
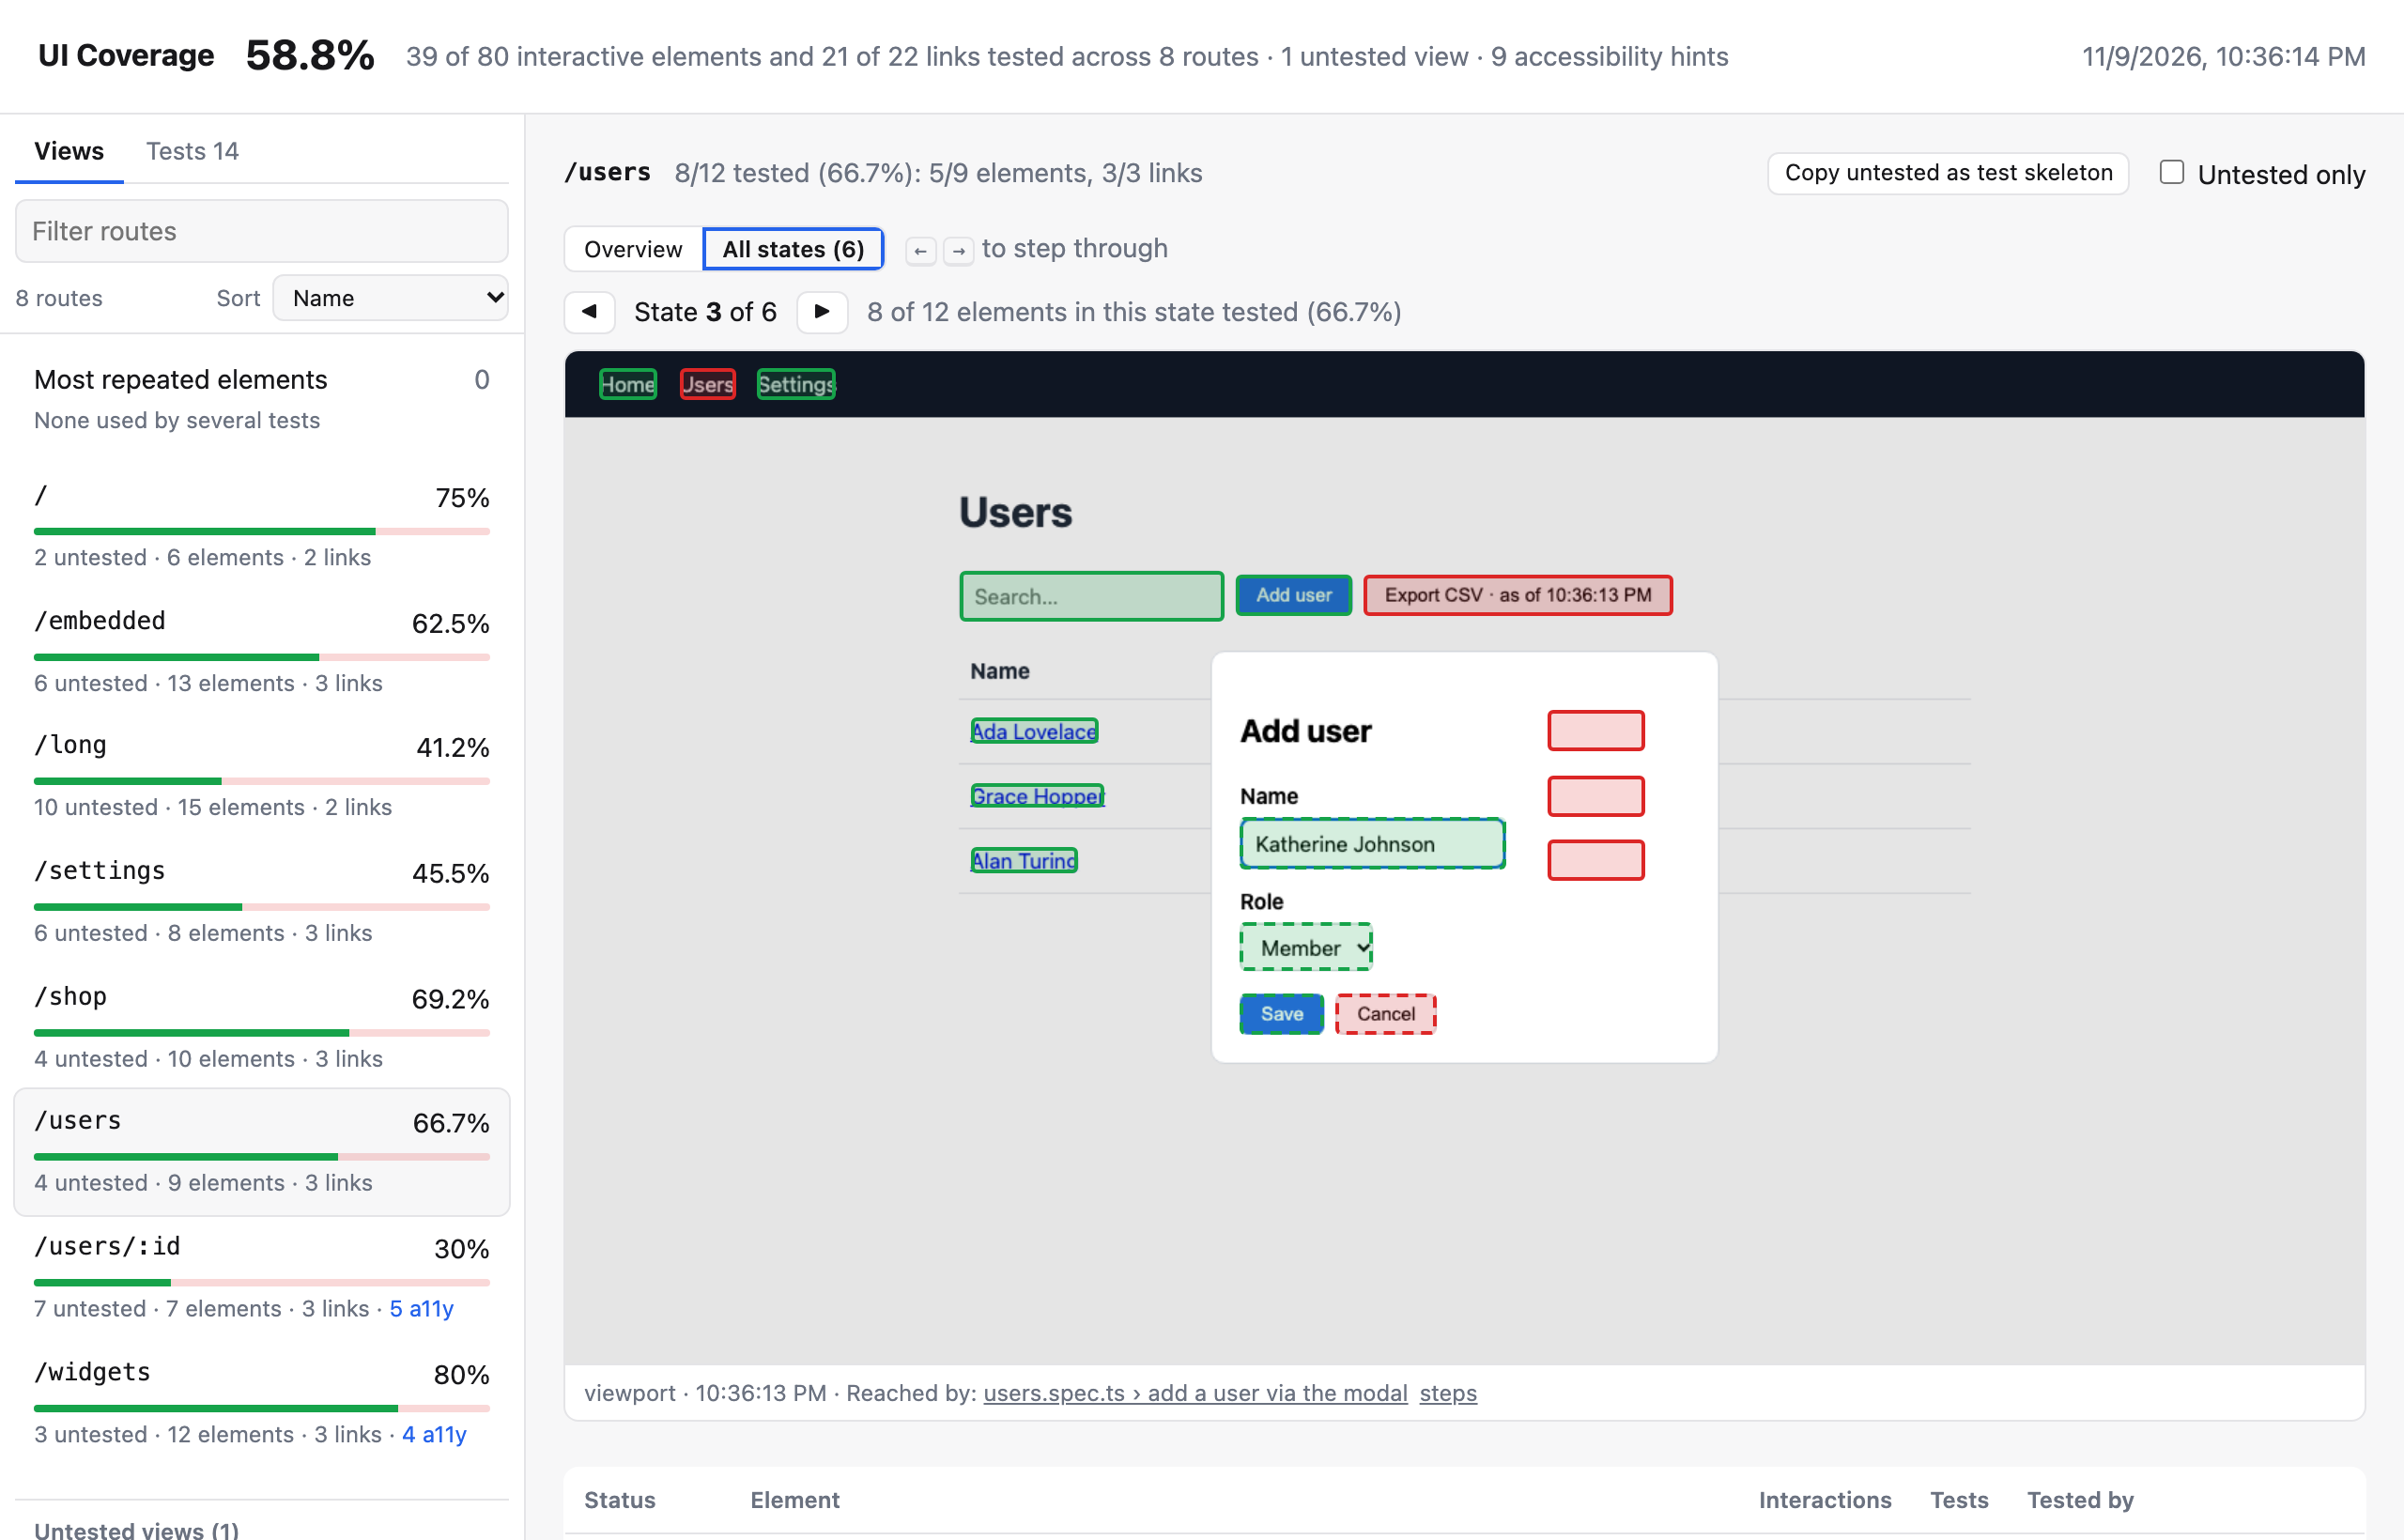
Without the recording option steps, the states are the screenshots the recorder takes anyway (when new elements appear). With steps: 'on', there's a screenshot after every step of every test, so you can follow what a page went through. The address bar keeps the state (#%2Fusers&state=3), so you can link to it.
Walk through a test
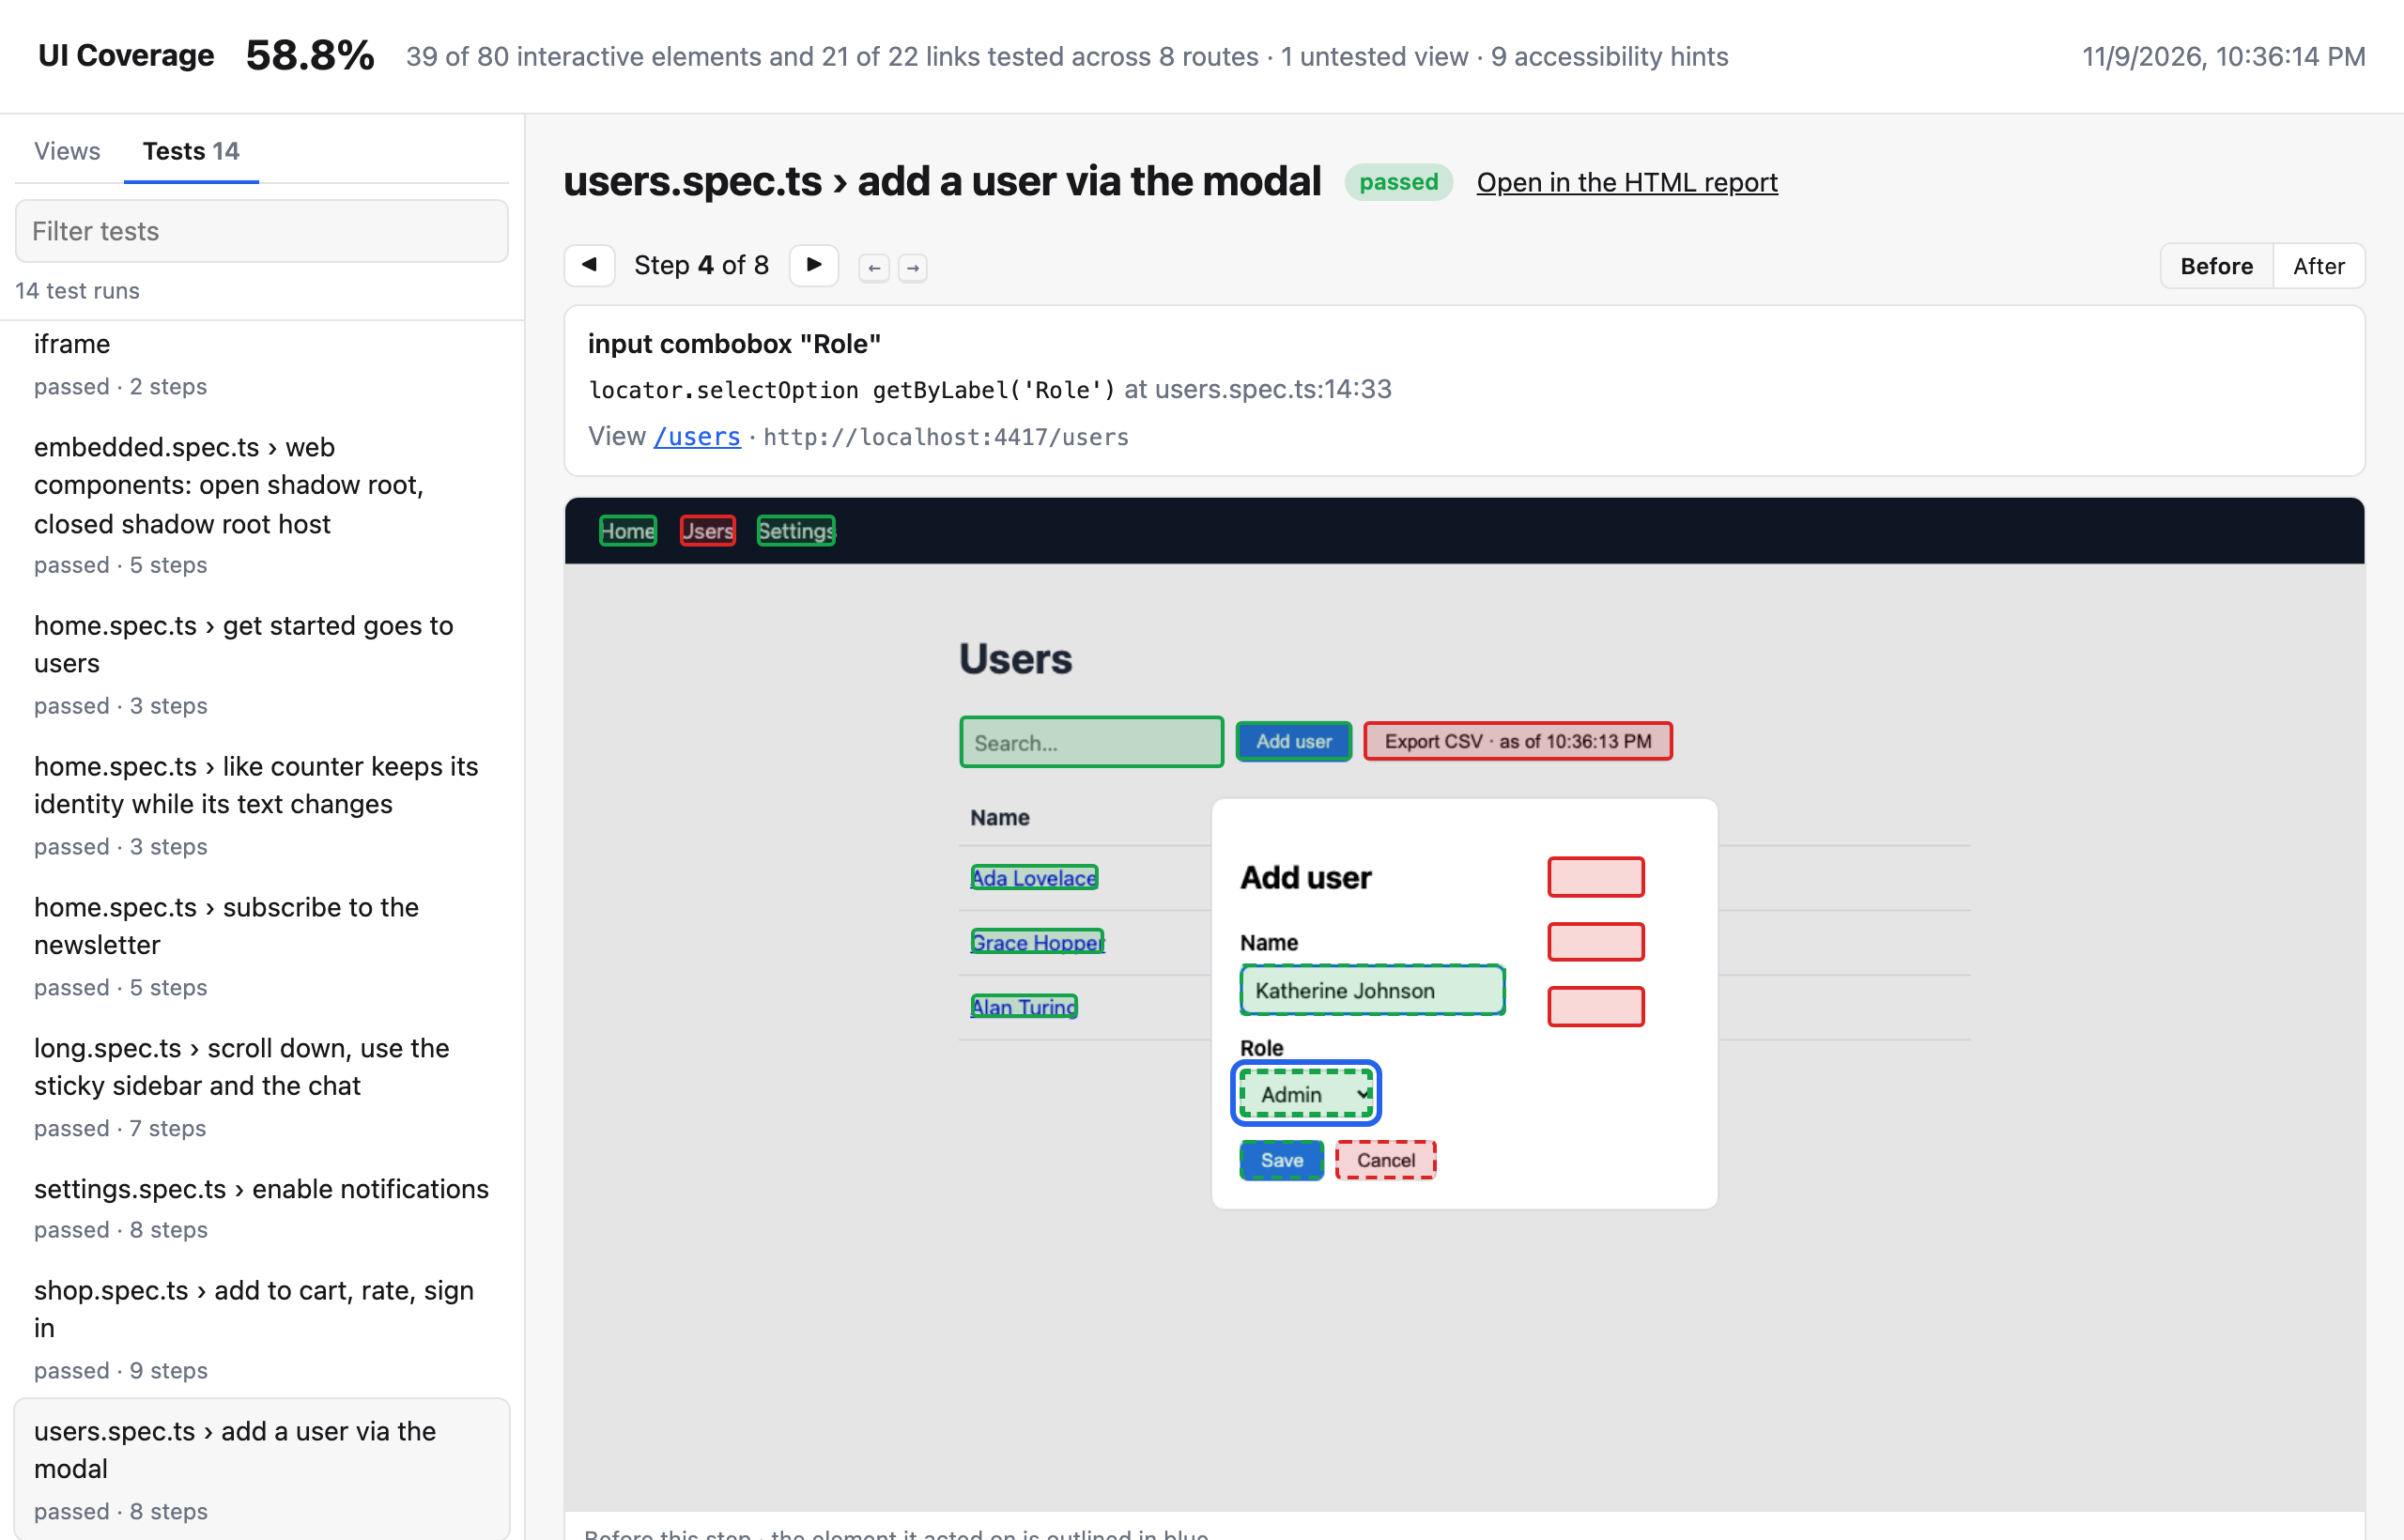
With steps: 'on', the Tests tab in the sidebar lists every test run, with its status and number of steps; filter it by name like the views. Select one to go through what it did, ◀ Step n of N ▶ (or ← and →):
- the action and the element (
click button "Save"), the Playwright call and where it is in the test (locator.click getByRole('button', { name: 'Save' })atusers.spec.ts:15:52), when they were recorded; - the view, linked to the state in All states, and the URL;
- the screenshot, with the element the step acted on outlined in blue and the other boxes green or red as everywhere else. Before shows the page the step acted on, After the page right after it; by default you see Before when it shows the element, After otherwise;
- every step of the test as a compact list (
1 load /users · 2 click button "Add user" · 3 input textbox "Name" · …), to jump to one.
Which instance a step acted on
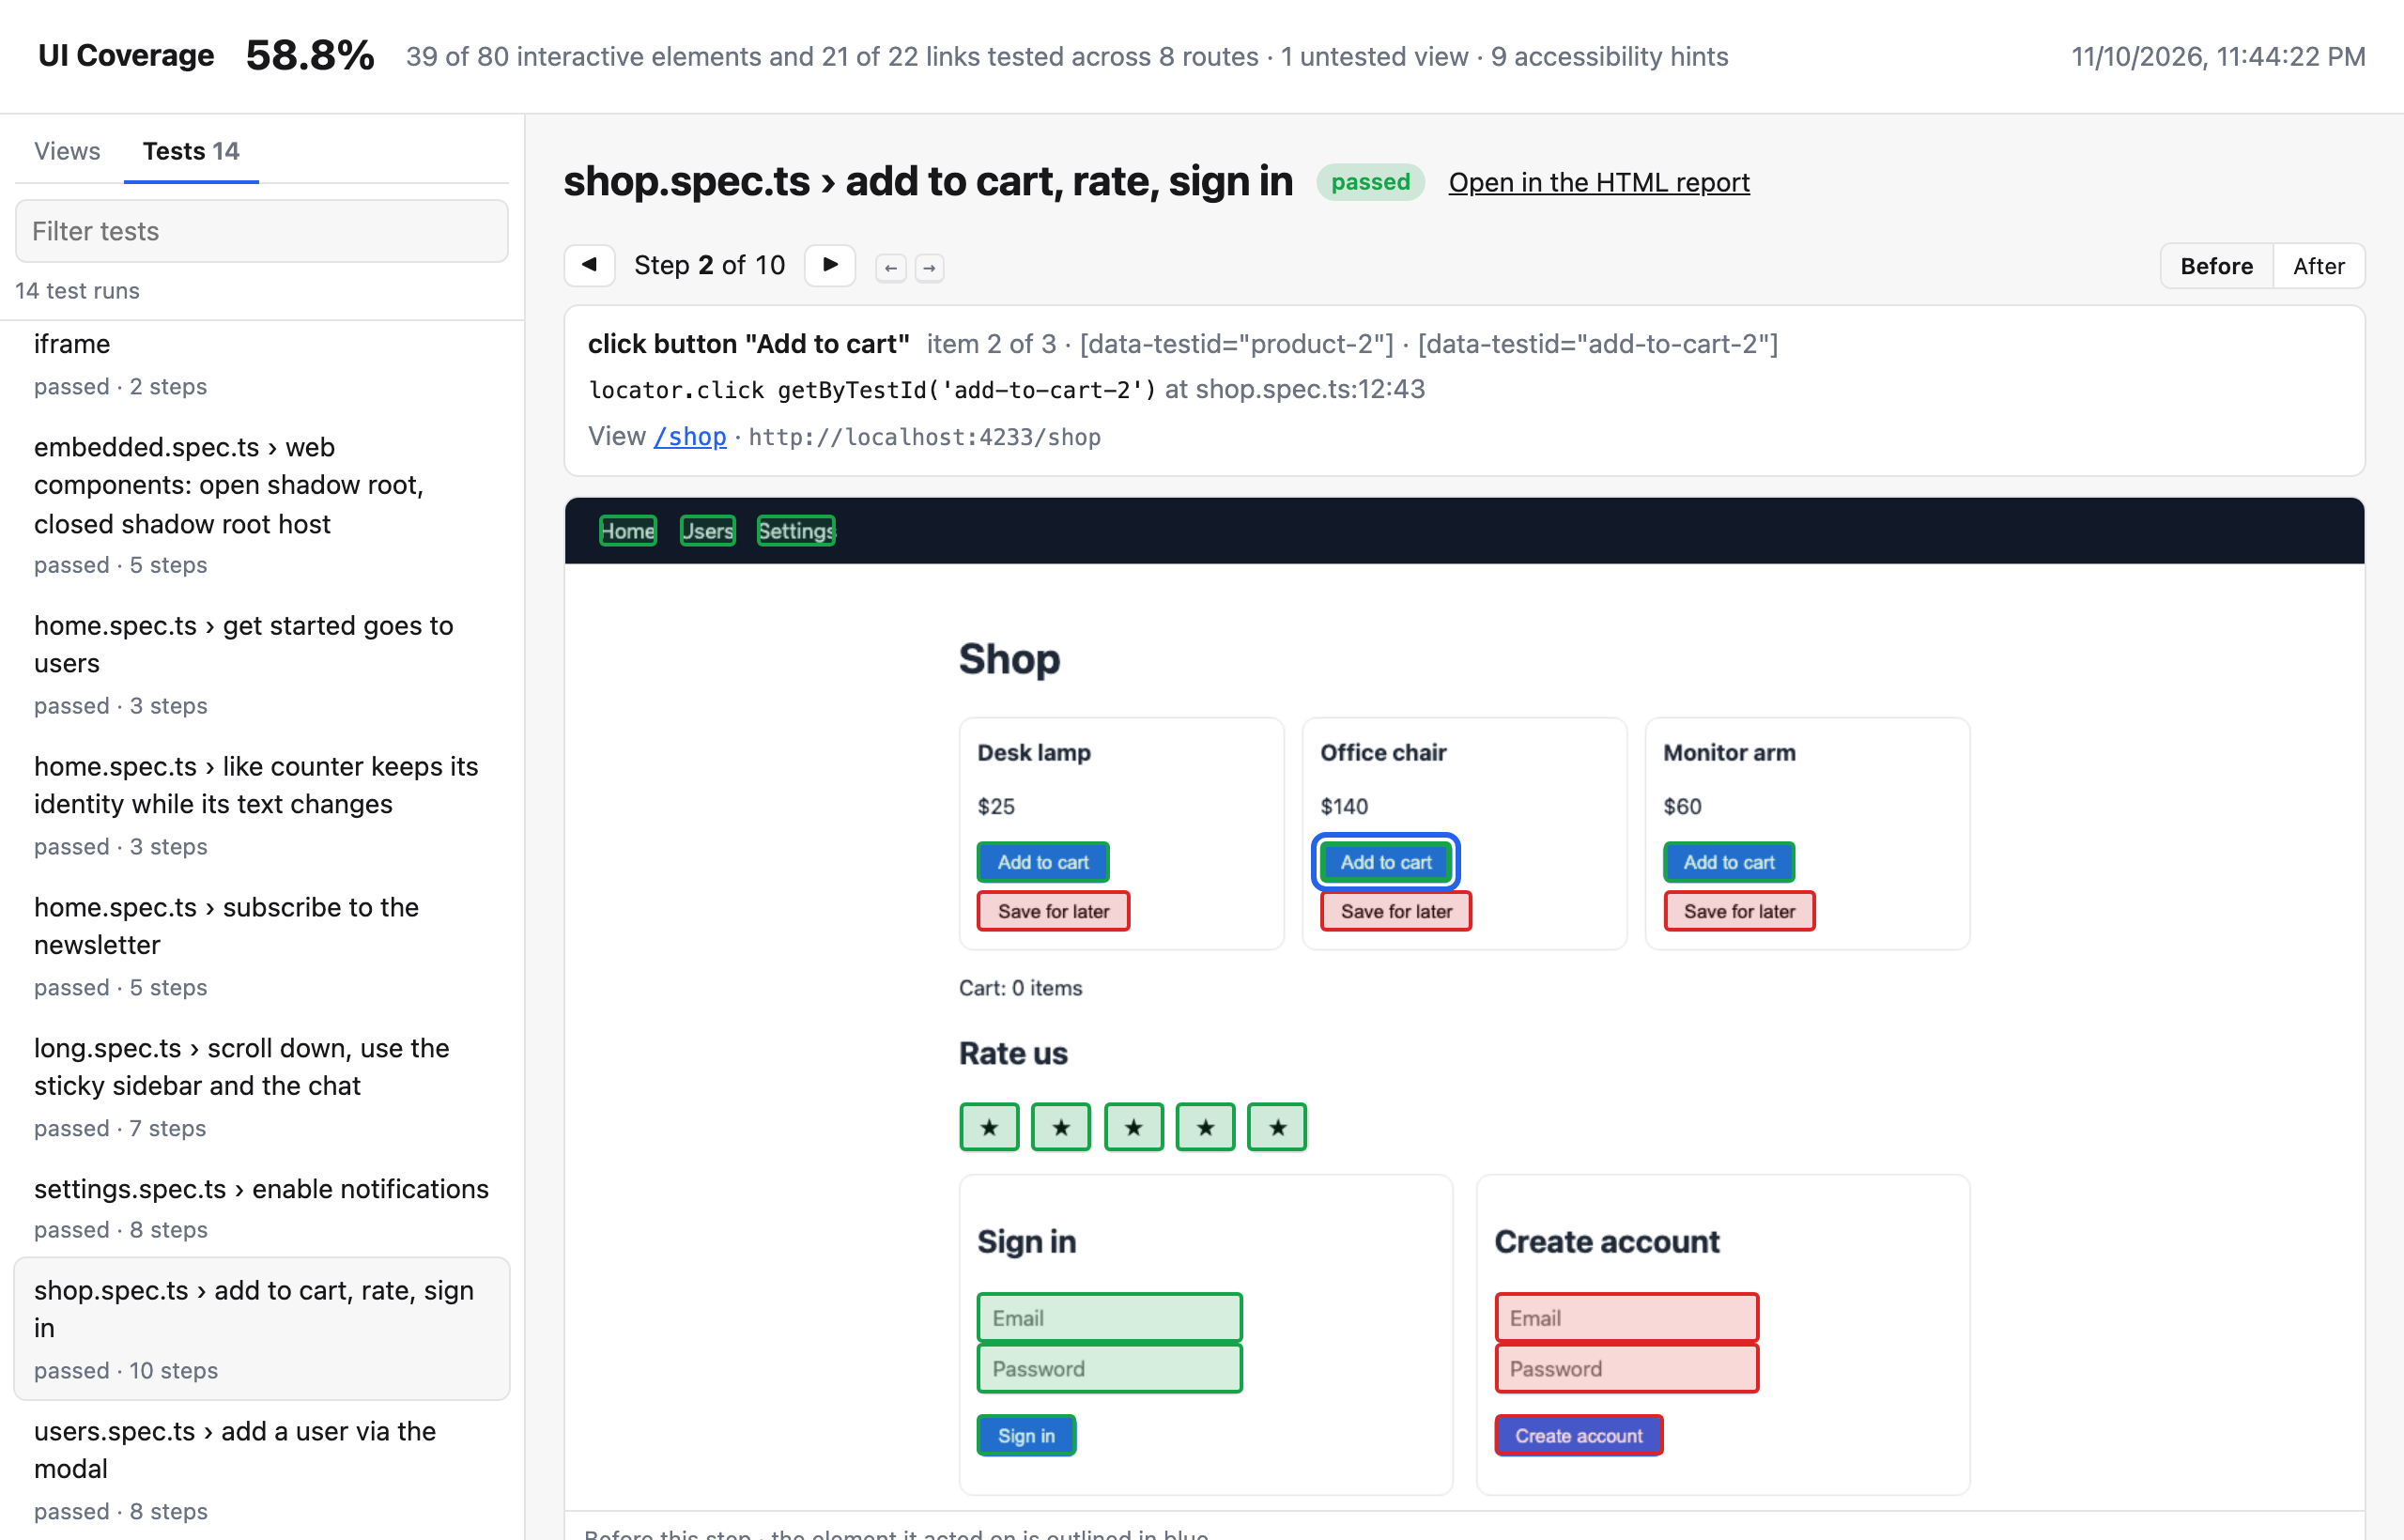
When the page showed the element several times, as one element of the report (a "Delete" on every row, an "Add to cart" on every card, see Element grouping), the step also says which one it acted on, next to the action and in the step list:
row 2 of 3 · #user-2: a table or grid row, by its position and, when it has one, its own identity. Grids number rows byaria-rowindexandaria-rowcount; a nested table names the outer row first (row 2 of 3 › row 1 of 4);item 2 of 3 · [data-testid="product-2"]: any other repeated structure (cards, list items, the stars of a rating), at the level where the instances part;- the element's own identity when it names the record (
[data-testid="add-to-cart-2"]).
Positions are the element's place in the page when the step acted on it. An identity is shown only when it is that instance's own: one every row has ([data-testid="row"]) isn't.
When an identity tells the instance apart, Before outlines only that one, even if rows moved in between. Otherwise (rows without identities) every instance is outlined, and the caption says so: a position alone can hold another record by the time of the screenshot.
Each test run has its own walkthrough: a flaky test that failed once and passed on retry is listed twice, the failed run marked failed (and the run whose interactions didn't count marked not counted, see Retries and failed tests). Under "Tested by", a step n link next to each test opens the step that acted on that element, and in All states each test under "Reached by" links to its steps. The walkthrough also links to the test's entry in Playwright's HTML report and its trace.
Each test's steps are loaded only when you open it (from steps/ next to index.html), so the report stays quick with many tests.
Find what's missing
Turn on Untested only to hide everything that's already covered:
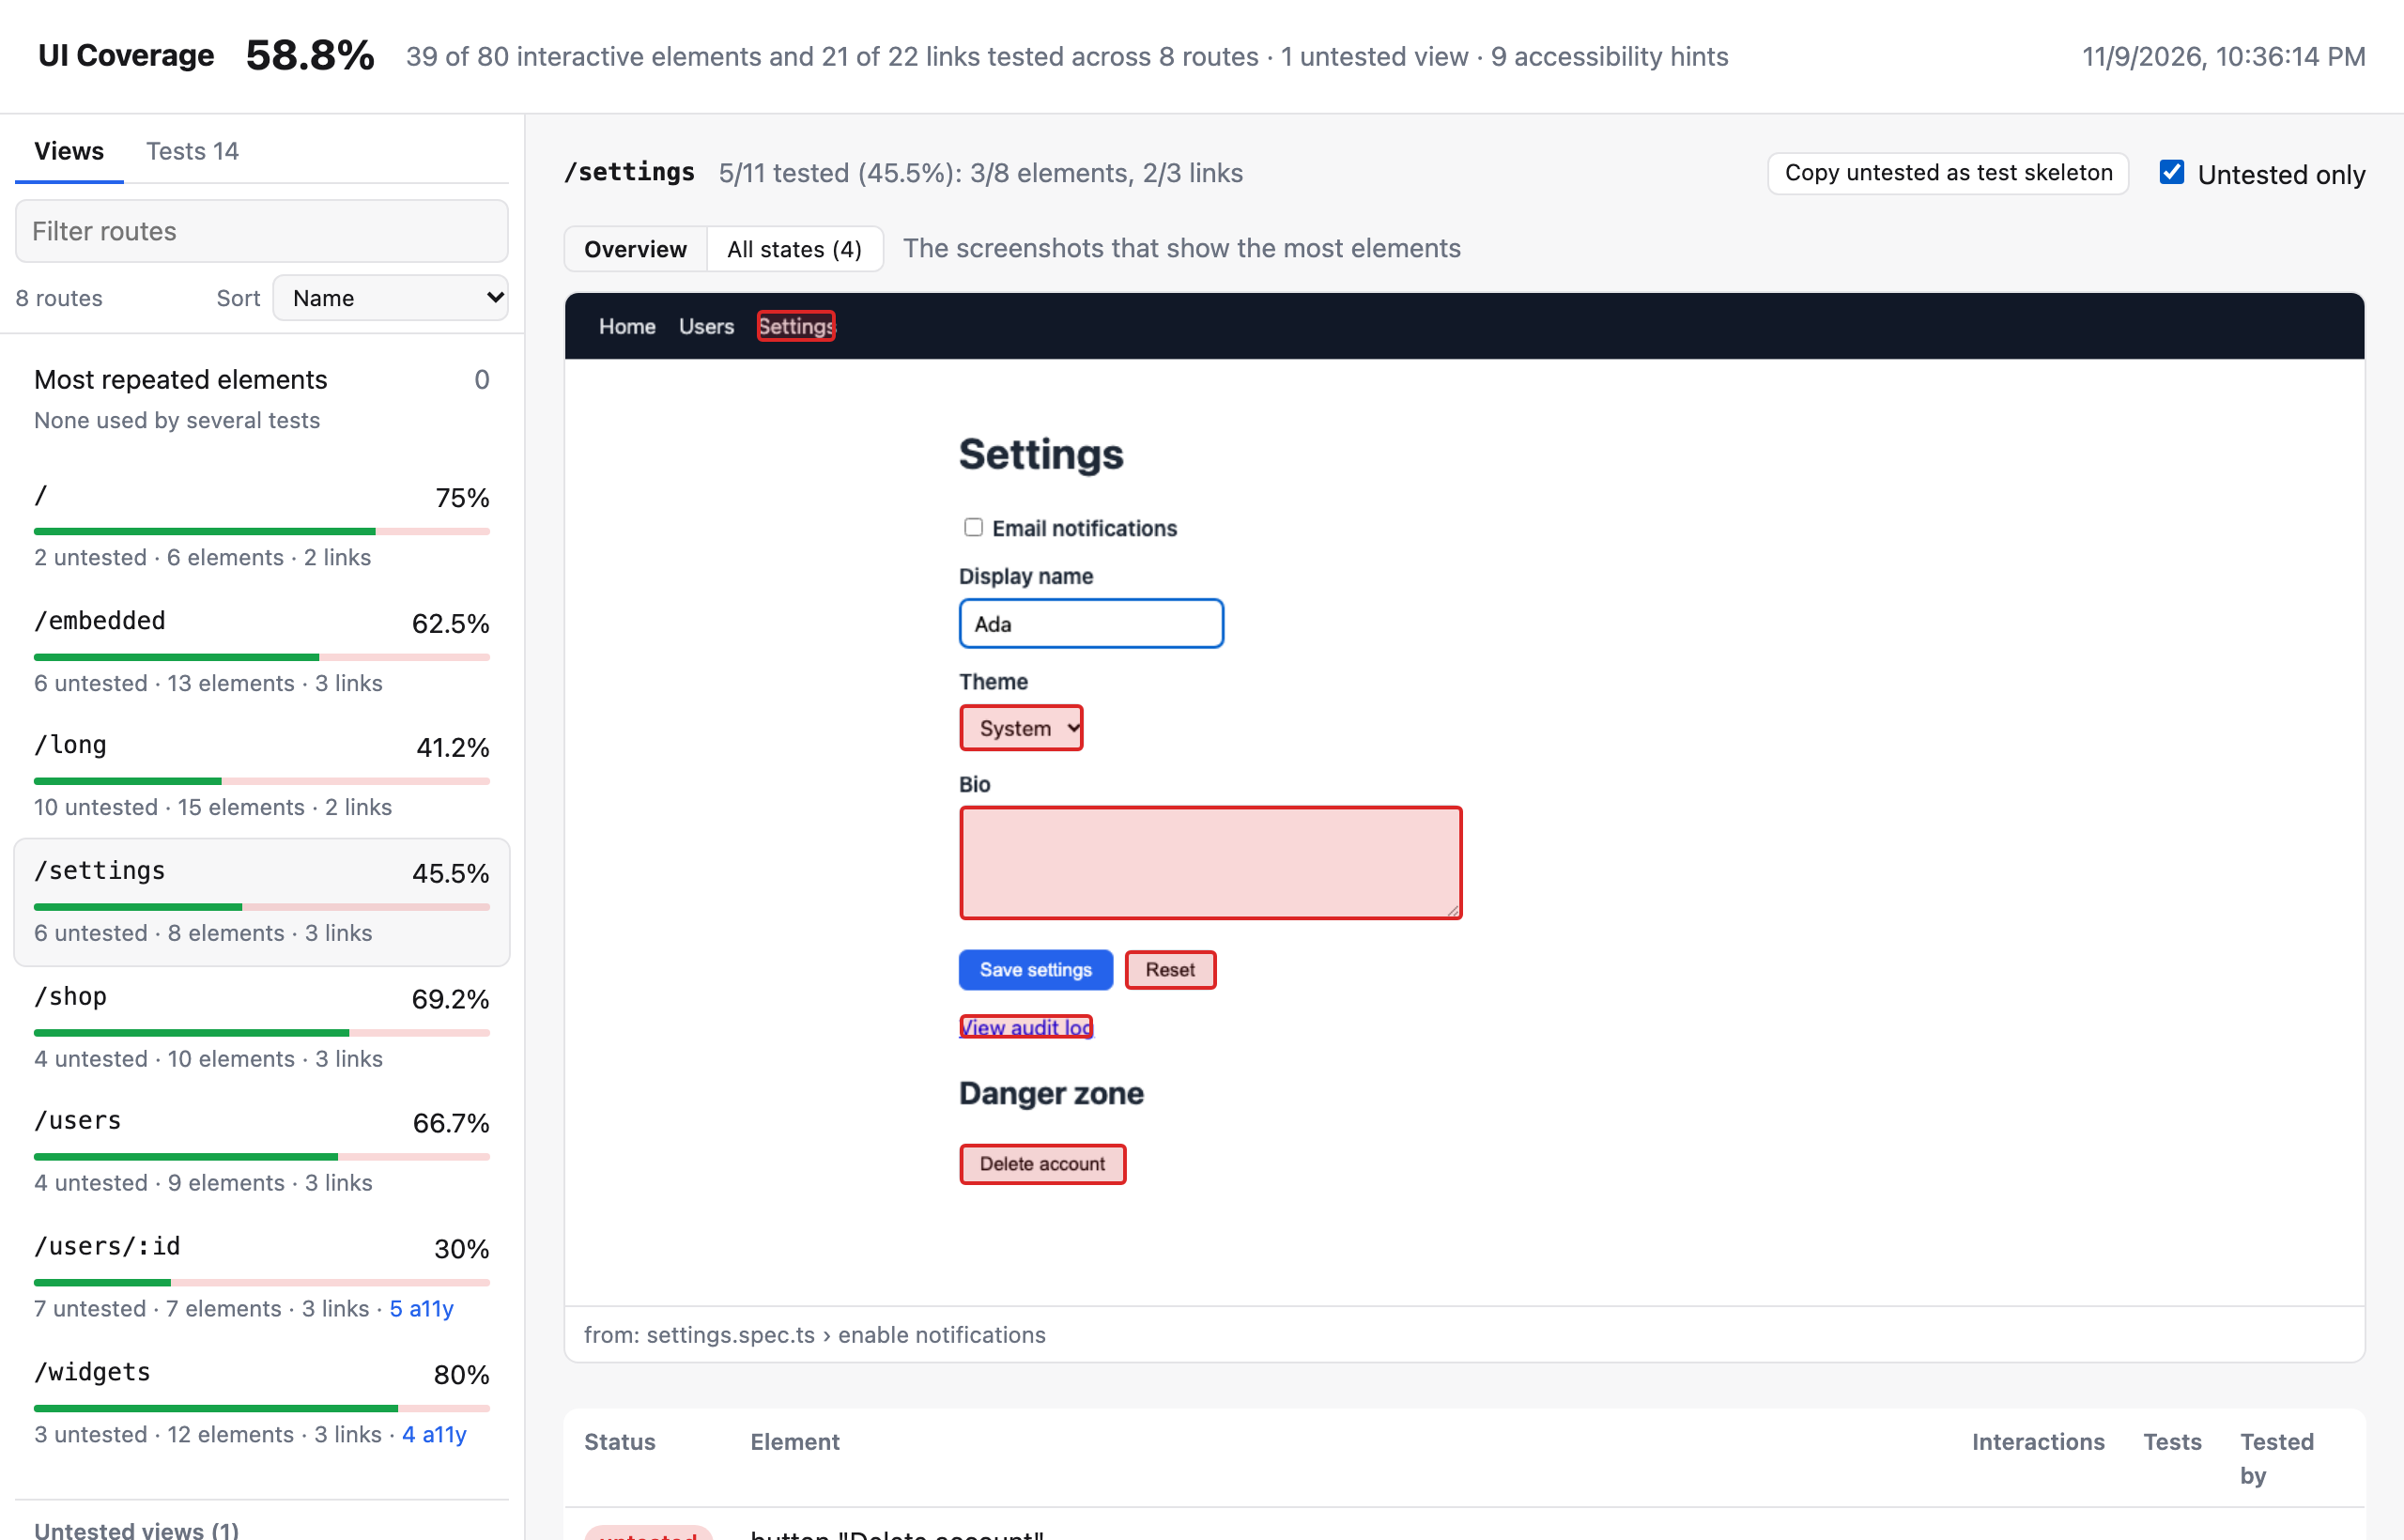
See where each element is, and which tests cover it
Below the screenshots, the element table lists each element with its status, label and the tests that covered it ("Tested by"). Hover a row to highlight that element on the screenshot; click an element's box on the screenshot to jump to its row.
Repeated elements, such as a "Delete" button on every row, are grouped into one entry, label (N instances), see Element grouping:
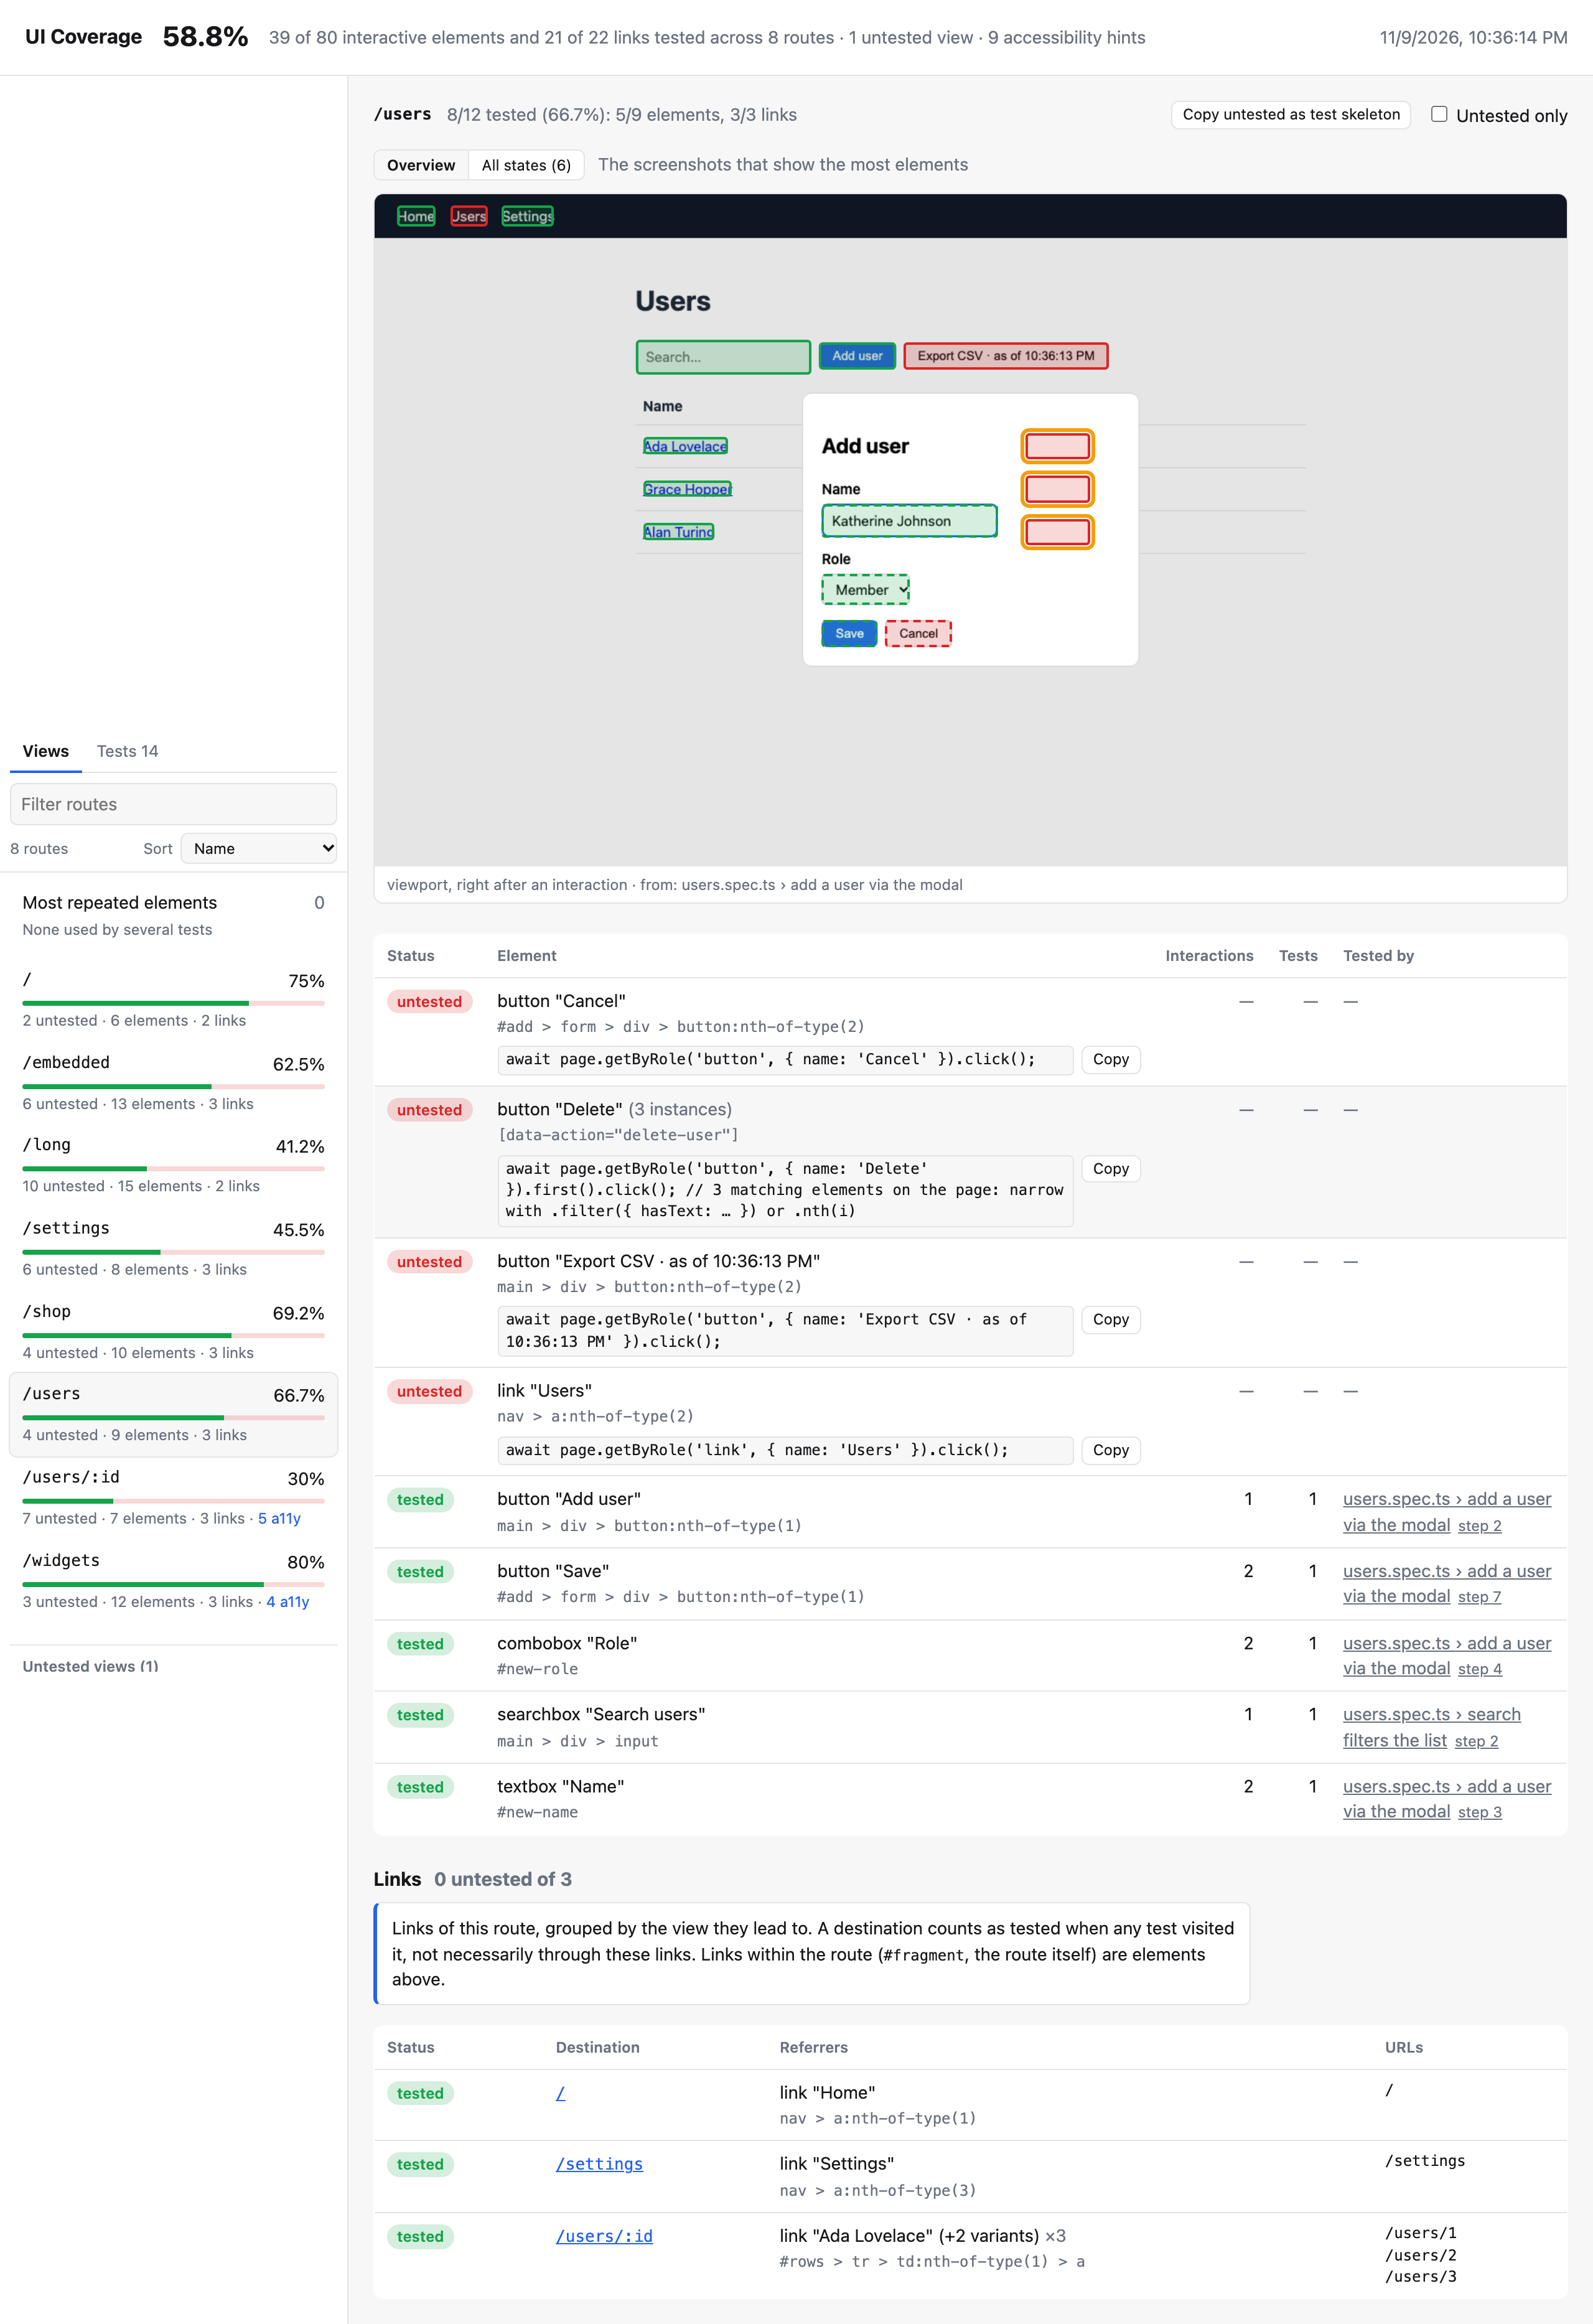
The tooltip of the tested label and of the Interactions cell shows the interactions that counted, by type (click: 3, input: 1).
Links and untested views
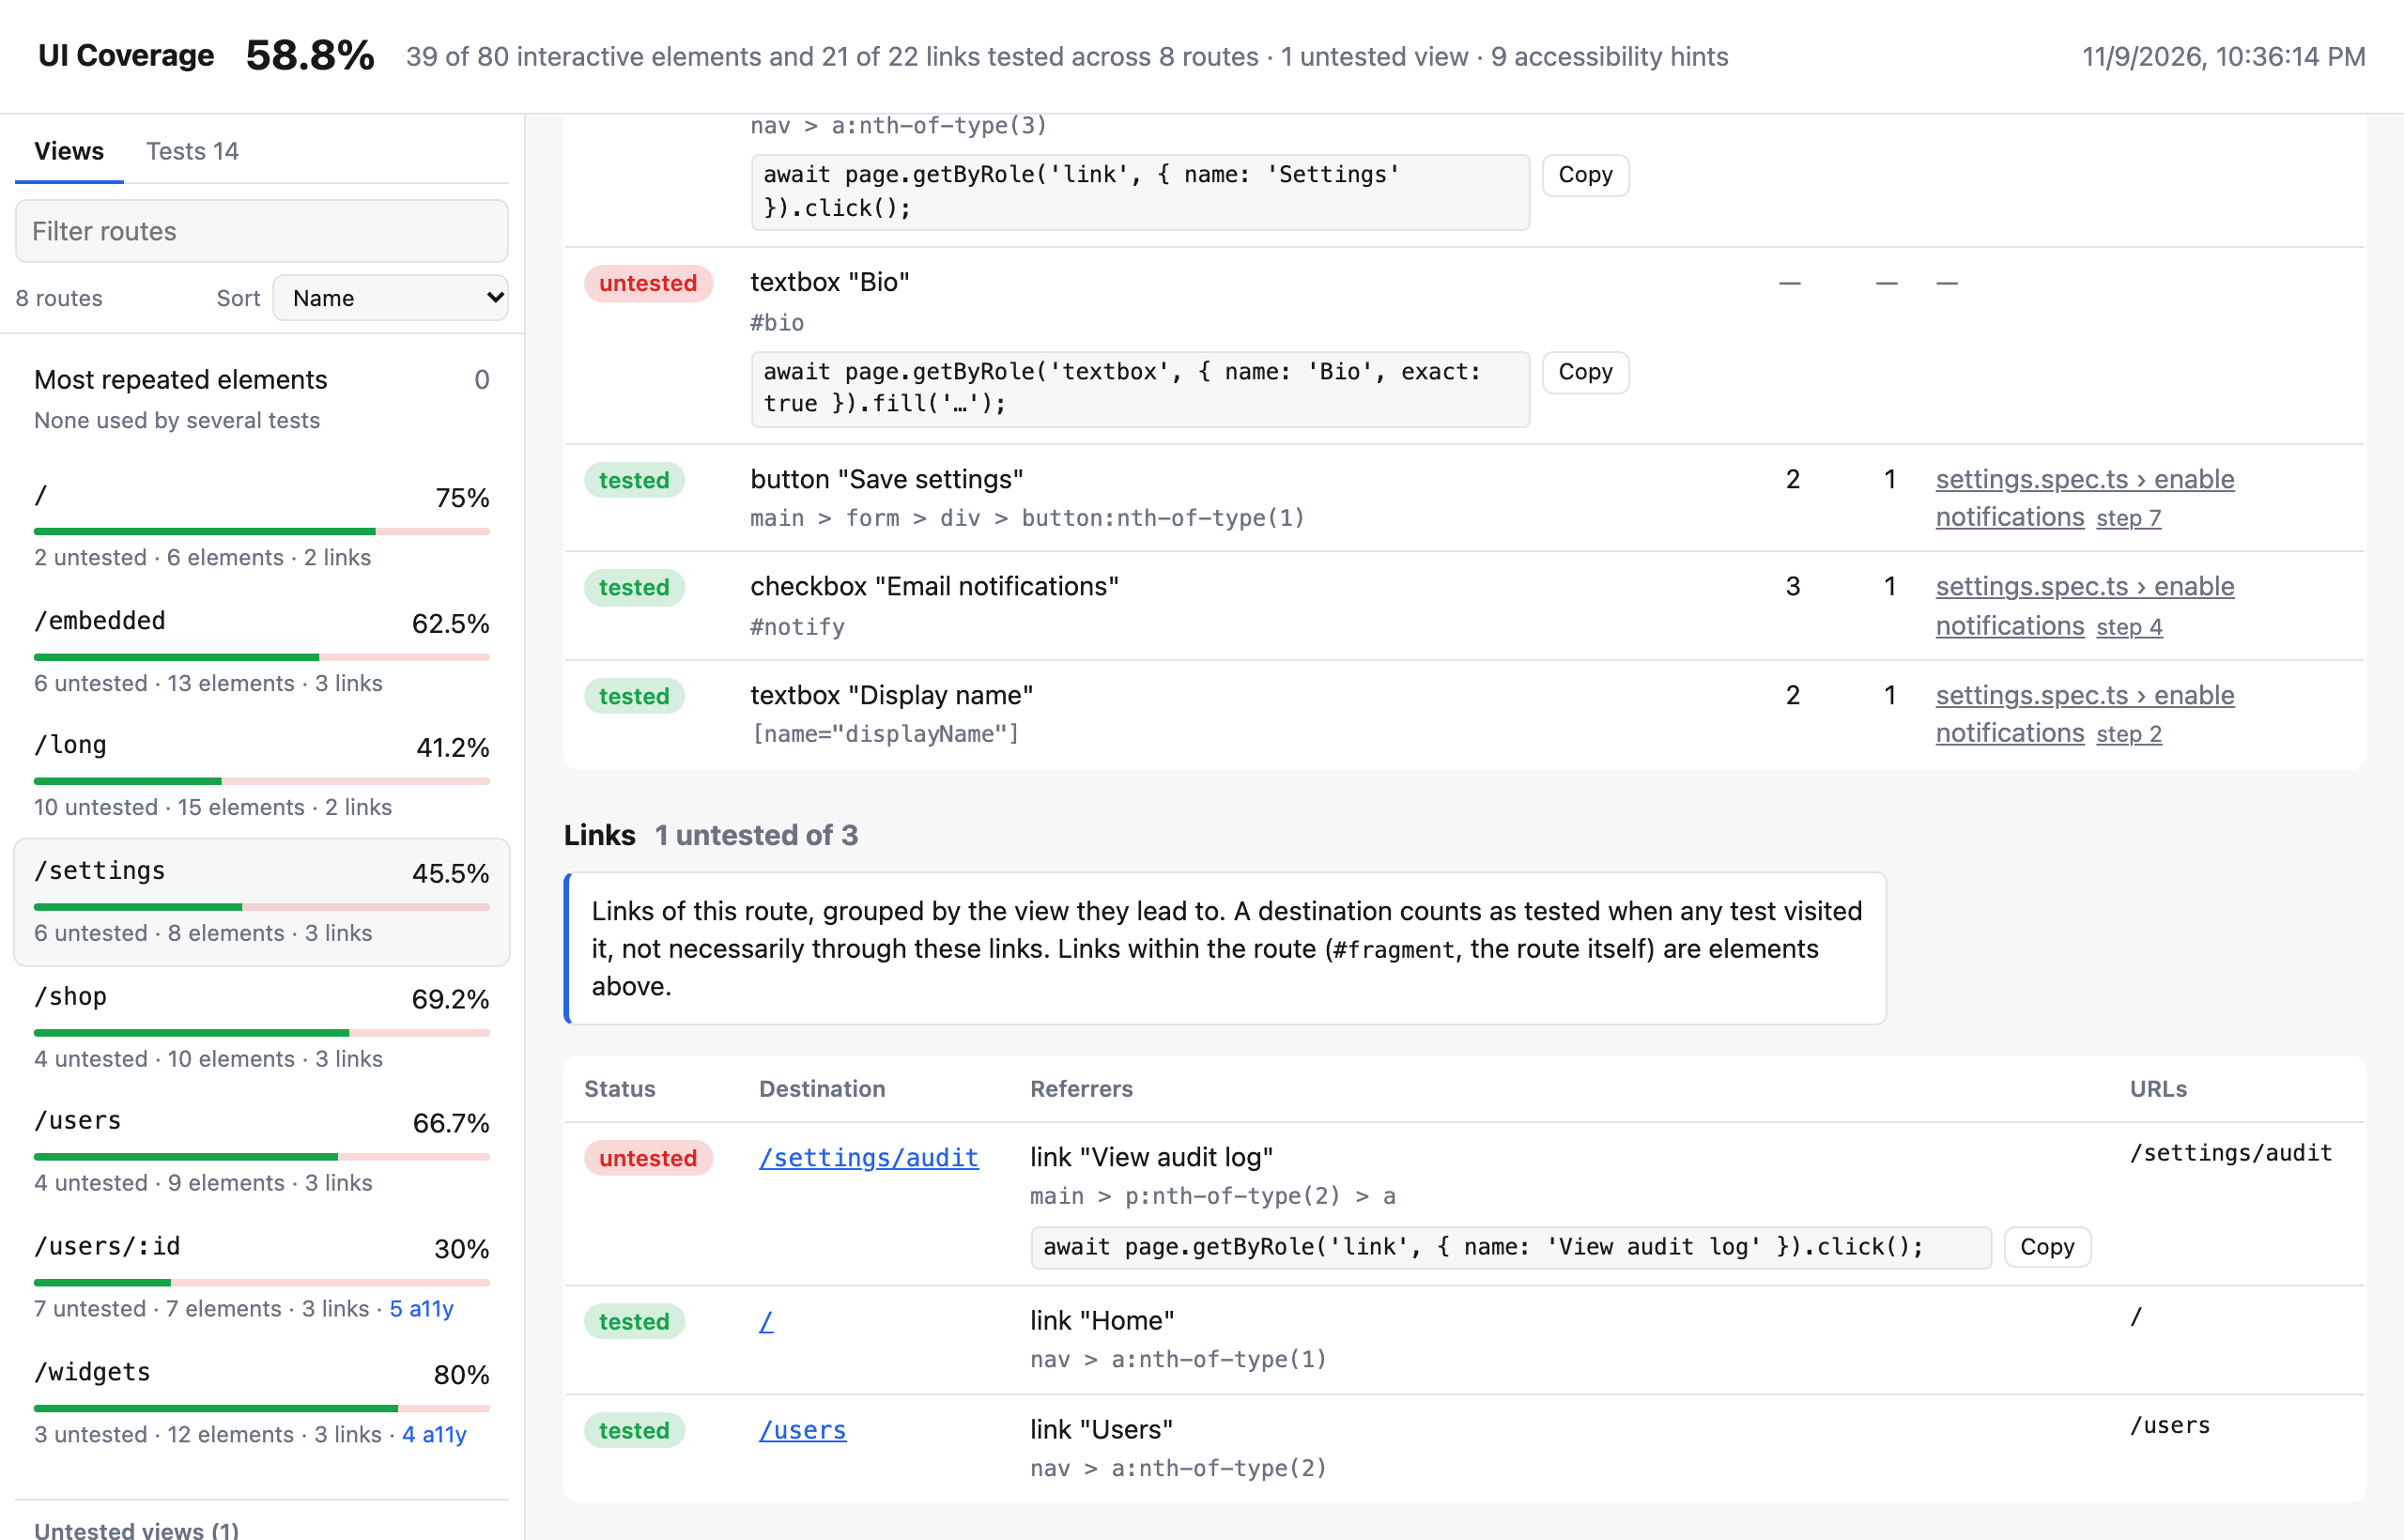
Each view also has a Links table: its links grouped by destination view, with the <a> elements that point there (Referrers) and the URLs. Views that no test visited at all are listed under Untested views in the sidebar. See Links and untested views.
Write the missing tests
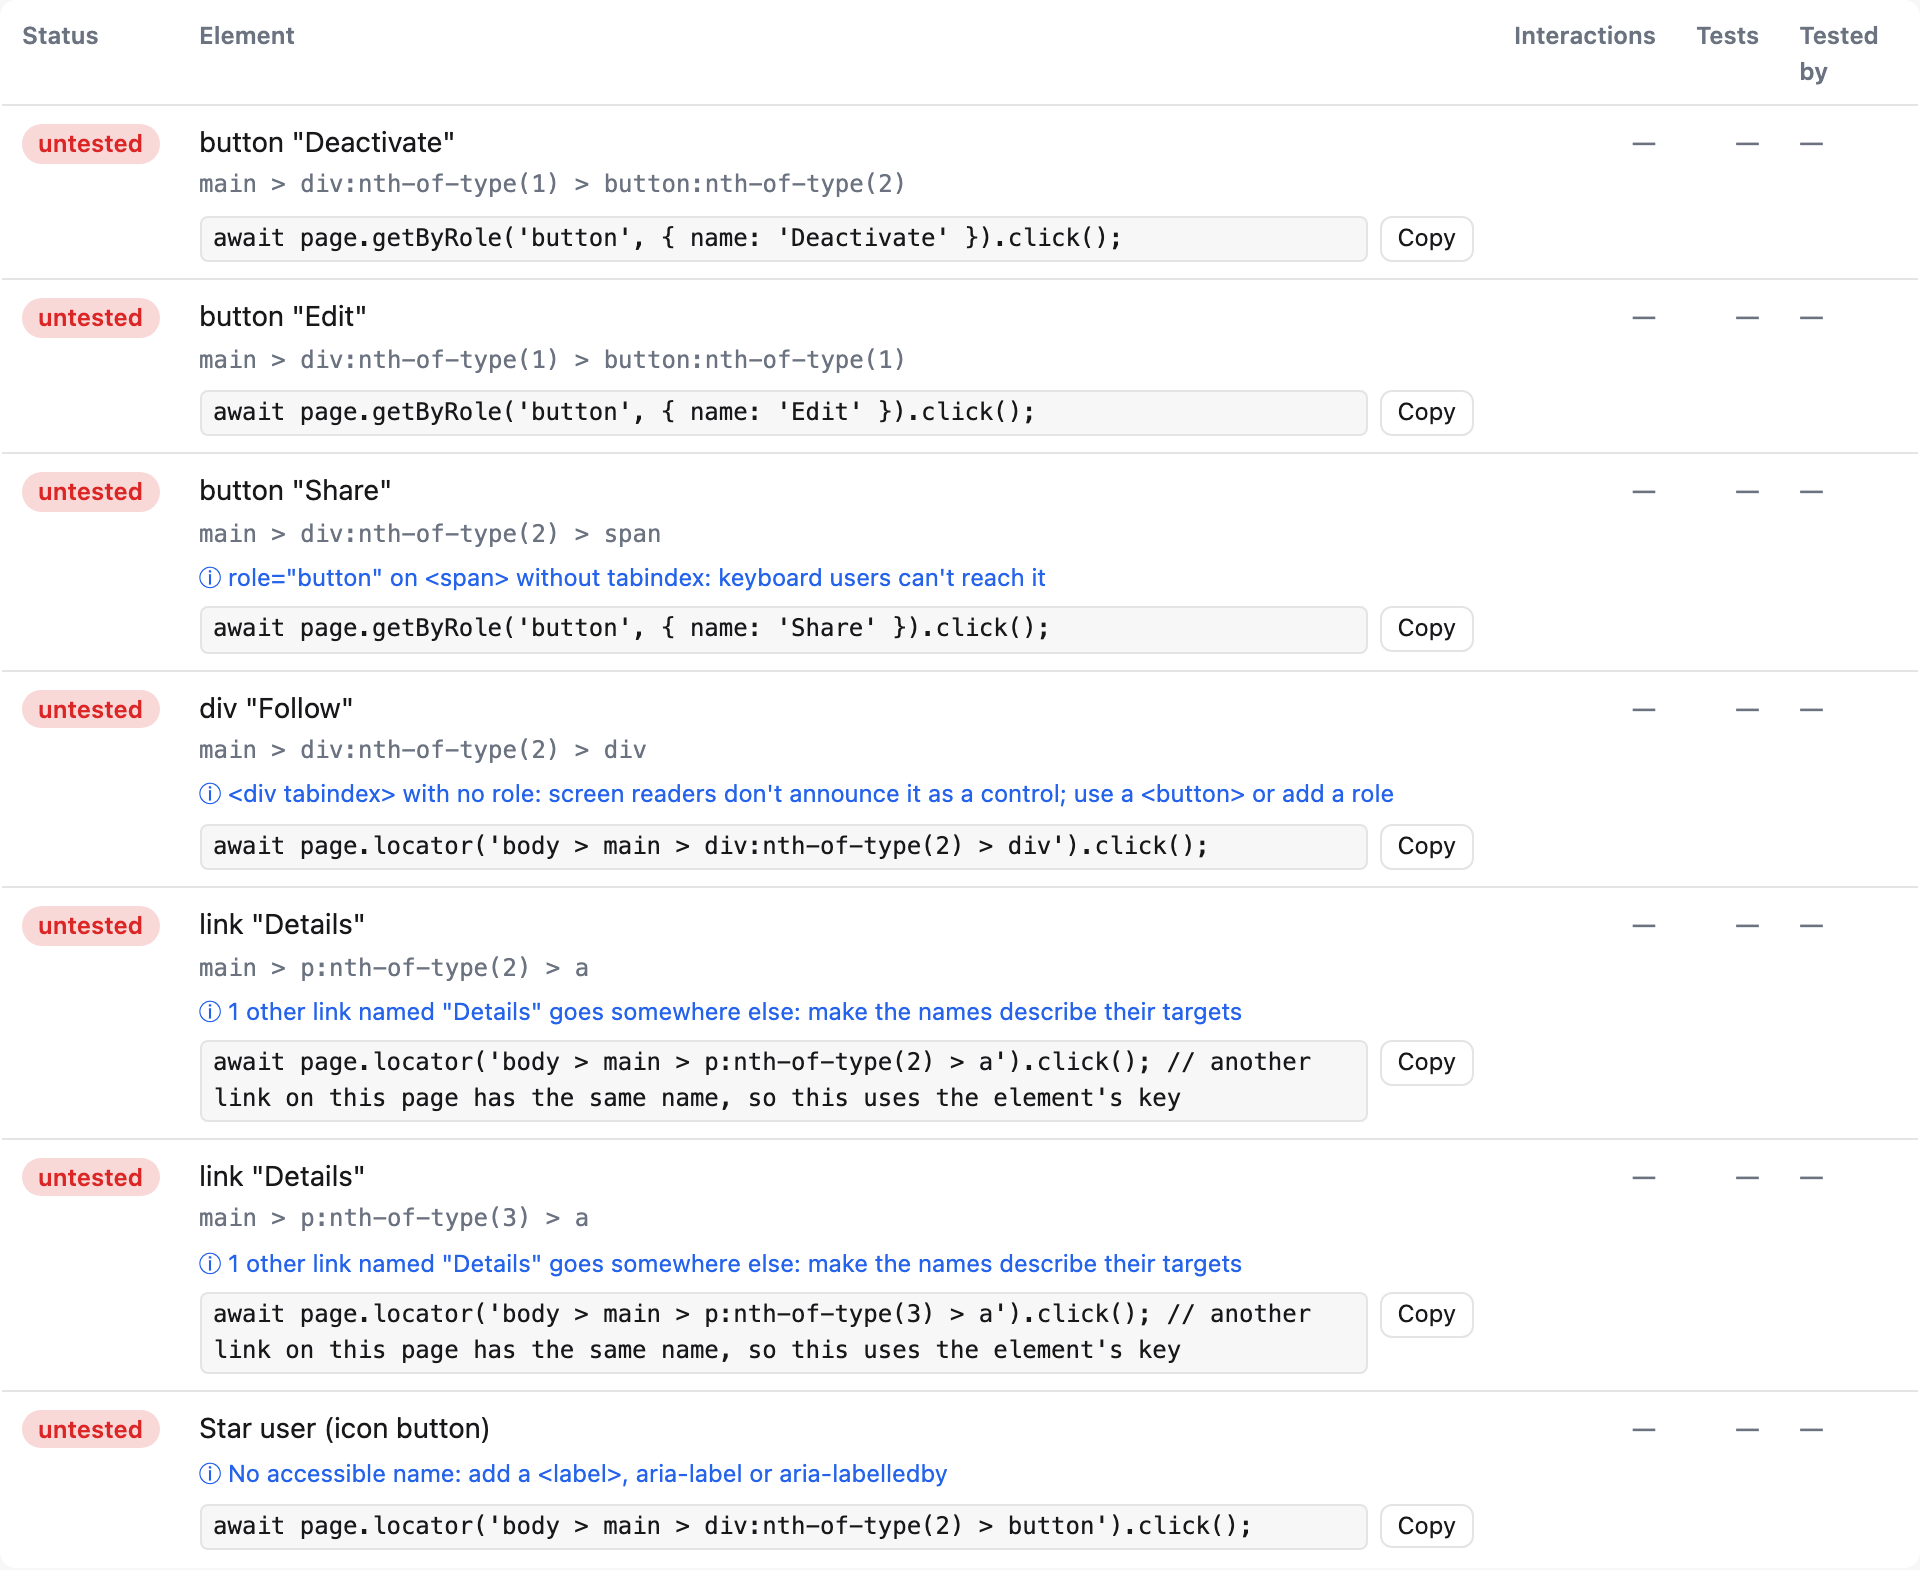
Each untested element has a ready-to-paste Playwright line with a Copy button, and Copy untested as test skeleton gives you a whole test for the view. Elements also get small, informational accessibility hints (in blue), such as a control without an accessible name. See Suggested locators and accessibility hints.
Jump to the test and its trace
With Playwright's HTML reporter configured, each test under "Tested by" links to its entry in the HTML report, and to its trace when one was recorded. See Insights and the HTML report.
Spot repeated setup
The element table shows how many times each element was used (Interactions) and by how many tests (Tests); click either header to sort by it. Most repeated elements in the sidebar lists the elements used by the most tests across the report, such as a login form that every test fills in first. See Insights.
Large suites
Filter views by name (press /), and sort them by name, lowest coverage or most untested elements. Screenshots load lazily. A synthetic report with 300 routes × 80 elements opens in about 0.1 s, and switching routes takes a few milliseconds (npm run perf in this repository measures it).
Dark mode
The report follows your system's light or dark setting:
Next to the report
The report folder also has:
coverage.json: the same results, machine-readable, for CI gates and dashboards. See coverage.json.data/: the raw recordings and every screenshot, used to rebuild the report with other rules.